Results of a soybean fungicide coverage trial comparing traditional and within-canopy application methods
Purpose of Study
White mold in soybeans has always been difficult to manage. The fungus that causes this disease produces long-lived survival structures and has a wide host range, causing economic losses in many crops important to NW MN, including soybean, edible beans, sunflower and canola. Partial resistance in soybean varieties means that in years in which weather favors disease, some yield loss is still likely to occur. Similarly, while there are several protectant fungicides labeled for white mold management, sub-optimal canopy penetration and coverage at the site of infection (flower buds at leaf axils) means that some yield loss likely occurs even with a well-timed application.
While the connection may not initially be apparent, the convergence of recent economic and environmental concerns and the availability of equipment that allows farmers to spoon-feed nitrogen (N) to their crops, paved the way for this soybean white mold management project. With corn producers feeling both an internal pressure to make sure that every last bit of N at least pays for itself and an external pressure to reduce N lost to the environment, some split their N, applying a baseline in the spring and coming back later on to side-dress the remaining N into a standing crop. It is the equipment that allows this in-season side-dressing to take place (think y-drop applicators) that provides an opportunity to research different fungicide application techniques.
In an effort to improve fungicide coverage, we compared coverage and efficacy when fungicides were applied either within the canopy between rows or in the typical over-the-top fashion. Personnel built a spray boom to position multiple nozzles between rows and within the canopy (Figure 1). Chemical-resistant hose, plumbing and sprayer fixtures and junctions were used to fashion the body onto which to affix the nozzle filters and nozzles. Zip ties were used to connect the nozzle body onto the bottom of a square, hollow steel pipe that would ride within the canopy and between rows. Plastic skid plates were bent and riveted to the steel pipe so that the pipe and nozzle body could easily glide through the canopy, minimizing potential plant injury. Details regarding the over-the-top and between-the-row sprayer setups can be found in Table 1. Note that while fungicides work best to protect plants when droplet size is small and more plant surfaces are covered, some fungicide labels suggest increasing droplet size for white mold management to ensure sufficient canopy penetration.
 |
|
Figure 1. Configuration of the tractor-mounted hydraulic-powered plot sprayer used to apply fungicides in this experiment. Note that two different within-the-canopy booms were built to allow application down the center of both 22 (Crookston study site) and 30 inch (Staples study site)-spaced soybean rows. The within-the-canopy nozzle body (black circle/square) rode approximately 12“ from the soil surface and the over-the-top nozzles (white circle/square) rode approximately 8“ above the soybean canopy.
Table 1. Details regarding the nozzle type and details, spray volume, speed, pressure and droplet size of fungicides applied over the top of the canopy and within the canopy. See Figure 1 for a picture of what both look like. |

Results
Treatments.
To improve the chance of white mold occurring, some plots were infested with the fungus that causes white mold (Sclerotinia sclerotiorum, Ss) and all plots were periodically irrigated after fungicide application. Experimental treatments included an untreated control that was neither infested with Ss nor treated with fungicide, a positive control in which plots were infested with Ss, but not treated with fungicide, and over-the-top and within-the-canopy fungicide treatments that were infested with Ss.
Assessing spray coverage and deposition.
Prior to applying fungicides, short (18”-tall, installed) pieces of metal fencing material were pounded into soybean rows in plots that were to have over-the-top or within-the-canopy applications; and small spring-loaded two-sided alligator-type clips were attached to them at 6” and 12” above the soil line. Just before fungicide application, water-sensitive paper was attached to the clips and oriented to sit within the canopy. After application and time for the water-sensitive paper to dry, personnel put on appropriate PPE and retrieved the papers, placing them into pre-labeled Ziplock-type bags to shield them from additional moisture or humidity. A scanner and USDA-developed software program called “Deposit Scan” were used to objectively analyze spray coverage on the water sensitive paper.
Data collected.
At the beginning flowering (R1) growth stage, 8 oz/A of Endura was applied to the center four rows of six 22 inch-row soybean plots at the Northwest Research and Outreach Center in Crookston and to the center four rows of six 30 inch-row soybean plots at the Central Lakes College Ag and Energy Center in Staples. Data that was collected from these plots included: fungicide coverage, white mold incidence and severity and harvest moisture and yield.
Yield.
Despite doing our best to initiate disease in these experiments, in 2020 warm temperatures prevailed after treatment and the growing season was dominated by historically severe drought conditions, resulting in no disease. Data from 2020 and 2021 differed significantly from one another (Staples: yield: P < 0.0001, moisture: P < 0.0001; Crookston: yield: P < 0.0001, moisture: P < 0.0001) and so yield and moisture data were analyzed separately by year. With the environmental conditions that prevailed after treatment, it was not a surprise that there were no differences observed among treatments for soybean yield in either year (2020: 66.7 bu/A average, P = 0.2869; 2021: 43.5 bu/A average, P = 0.2395) and moisture (2020: 12.0% average, P = 0.2307; 2021: 16.0% average, P = 0.2732) at the Staples site and yield (2020: 29.8 bu/A average, P = 0.9644; 2021: 15.9 bu/A average, P = 0.7894) and moisture (2020: 8.8% average, P = 0.1882; 2021: 11.7% average, P =0.9218) at the Crookston site.
Fungicide coverage.
Fungicide coverage data from the two research locations for water sensitive paper placed 6 inches and 12 inches above the soil line were first analyzed to determine whether years differed or whether data from both years could be combined; analysis indicated that data did not differ between years (Staples, 6-inch: P = 0.2498, 12-inch: P = 0.9375; Crookston, 6-in: P 0.2498, 12-inch: P = 0.7385) and so data from 2020 and 2021 were combined for analysis. The within-the-canopy application resulted in significantly better fungicide coverage within the soybean row at both 6 and 12 inches above the soil line than the over-the-top application in the 22 inch rows in Crookston (Table 2, Figure 2). In 30 inch rows at Staples, the within-the-canopy application resulted in numerically better fungicide coverage at 6 inches above the soil line (Table 3) and statistically better coverage at 12 inches above the soil line compared to an over-the-top application. We speculate that at the CLC in Staples the thick canopy may have interfered with fungicide penetration at the 6-inch height regardless of application method.
 |
|
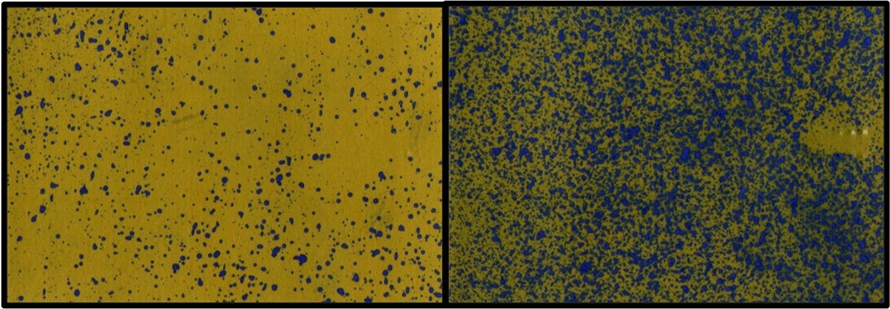
Figure 2. Water sensitive paper that had been placed 6 inches above the soil line in the soybean row before fungicide was applied using either the traditional over-the-top method (left) or the experimental within-the-canopy method (right). A document scanner and the Deposit Scan software was used to impartially assess spray coverage and fungicide deposition. Note that darker areas indicate where fungicide droplets fell on the water sensitive paper. |
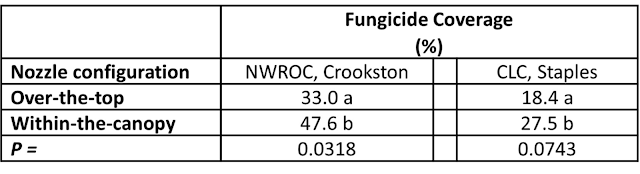
Table 2. Coverage (%) of fungicides applied over-the-top or within-the-canopy captured by water-sensitive paper placed within the R1 soybean canopy at 6 inches above the soil line in 22 inch rows at the NWROC in Crookston and in 30 inch soybean rows at the CLC in Staples. Treatment means within a column followed by different letters are statistically significantly different from one another.

Table 3. Coverage (%) and deposition (microL/cm2) of fungicides applied over-the-top or within-the-canopy captured by water-sensitive paper placed within the R1 soybean canopy at 12 inches above the soil line in 22 inch rows at the NWROC in Crookston and in 30 inch soybean rows at the CLC in Staples. Treatments means within a column followed by different letters are statistically significantly different from one another.
Many people at the University of Minnesota and Central Lakes College contributed to this project including: Jeff Nielsen, Michael Leiseth, Hannah Barrett and Dean Malvick.
This project was sponsored by check-off dollars through the Minnesota Soybean Research & Promotion Council.

Comments
Post a Comment